
The Bear Market Might’ve Begun
- Jan 6, 2022
- 4 min read
Updated: May 26, 2024
2021 Breakdown
The month of December was painted red for most of the crypto market. Following a year consisting of a large cap spring, a JPEG summer, and a metaverse Fall, a crypto winter was inevitable. Bitcoin (BTC) fell -18.93% and Ethereum (ETH) followed suit with a -20.72% loss. Metaverse-affiliated cryptoassets experienced a more intense pullback with Decentraland (MANA) and Enjin Coin (ENJ) seeing -29.80% and -26.50% losses, respectively. There was significant outperformance in Layer 2 Scaling solutions in projects such as Polygon (MATIC) with a 41.28% gain.
This difference in performance across the crypto market further stresses the idea of diversification outside of large capitalization assets to gain alpha. Let’s take a look at the chart below to get a macro view.

Crypto Total Market Cap (TOTAL), Source: TradingView
TOTAL represents the crypto total market capitalization. TOTAL3 represents the crypto total market capitalization, excluding BTC and ETH. This gives us a view of the market outside of ultra-large capitalization assets to get a better performance assessment of the emerging assets in crypto.
Comparing the two gives an idea of where alpha over the market came in during 2021. It can be observed that TOTAL3 outperformed TOTAL, indicating that having exposure to assets outside of BTC and ETH was worthwhile. The increased reward came with increased volatility, however.
For the first time in 17 weeks, the crypto market posted outflows. Not only did it break the streak, but it was also the most significant single-week outflow in the year of 2021.

Source: CoinShares
The week of outflows totaled $142M. Bitcoin and Ethereum contributed most of the blow to the flows, while alternative assets like Solana and Polkadot reduced the downward pressure with inflows at $6.7M and $2.5M, respectively.
Understanding the Bitcoin Cycle
It has recently become a concern that crypto is entering a bear market among the fund manager community. The conversation should have began in May 2021 during the market’s steep losses. However, it is a difficult task to look for evidence of a peak while NFTs and related tokens are in a parabolic upside event.
Although BTC reached an all-time high of $69,000 in November 2021, it is reasonable to assume the long-term bull trend ended in May 2021. Understanding the patterns in the data help simplify the big picture without solely relying on price. Before diving into the BTC graphic below:
Market Cap: The total value of all BTC in circulation.

Realized Cap: The total value of all BTC in circulation using a last-mover methodology, factoring in unspent transaction output, or UTXO, to get a more accurate estimate by considering a possible discount for coins that have remained unmoved for a long period.

MVRV Z-Score: a representation of extremes in data between Realized Cap and Market Cap by utilizing a standard deviation test.
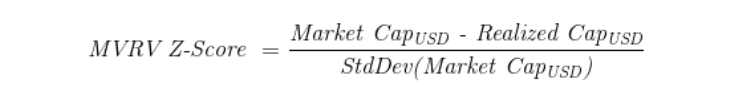

MVRV Z-Score, Source: lookintobitcoin.com
The MVRV Z-Score above allows us to identify a period wherein BTC is extremely overvalued relative to what is accepted to be its true value. It can be seen that significant peaks in the Z-Score have been analogous with bull-trend inflection points.
The Z-Score data in May 2021 tells a story. Although the difference in true value had not reached the levels of 2014 and 2018 peaks, it was significant enough to warrant a pull back.
The Z-Score data in May 2021 tells a story. Although the difference in true value had not reached the levels of 2014 and 2018 peaks, it was significant enough to warrant a pull back.
The Bitcoin Halving. Halving is a cyclical event programmed into the source code of the Bitcoin Network. Roughly every four years, the rate at which miners can earn BTC through transaction validation is halved. Fundamentally and simplistically, this means the rate of supply issuance is cut in half.

The Bitcoin Halving, Source: CoinDesk
Since inception, Bitcoin has ‘halved’ three times. Once in 2012, another in 2016, and the most recent in 2020. There will be another halving in a few years, estimated to be early 2024.
It needs to be mentioned that this is the case for Bitcoin and only Bitcoin. Each crypto asset has its own monetary system that determines incentives, distributions, and issuance. We call this independent monetary system of a cryptoasset: token economics (tokenomics for short). Bitcoin may halve roughly every four years, but Ethereum doesn’t. Neither does Terra, Solana, Stellar, or Avalanche. This system is independent to Bitcoin and forks of Bitcoin.
Why does each Bitcoin Halving appear to have resulted in a substantial price appreciation? — Supply and demand.

BTCUSD Log Supply vs. Demand, Source: Tradingview
The rate at which miner’s introduce supply to circulation is halved, yet demand (roughly) remains the same. This is cause for a quick progression of change in value. There is a shortage in coins available to the demand; this immediate scarcity drives appreciation.

Total Miner Revenue, Source: Glassnode
This observation raises the question: did the Bitcoin bear market begin in May?
The answer is: well, maybe. It depends on your definition of a bull trend and bear trend.
I’m not much of a believer in calling market tops or bottoms. The realism is that the market cycles in price are complex and overwhelming for the human mind. In order to correctly navigate price and diminish risk, a higher computational force that can simultaneously find harmonious patterns in multiple conjunctive datasets.
I’m not much of a believer in calling market tops or bottoms. The realism is that the market cycles in price are complex and overwhelming for the human mind. In order to correctly navigate price and diminish risk, a higher computational force that can simultaneously find harmonious patterns in multiple conjunctive datasets.